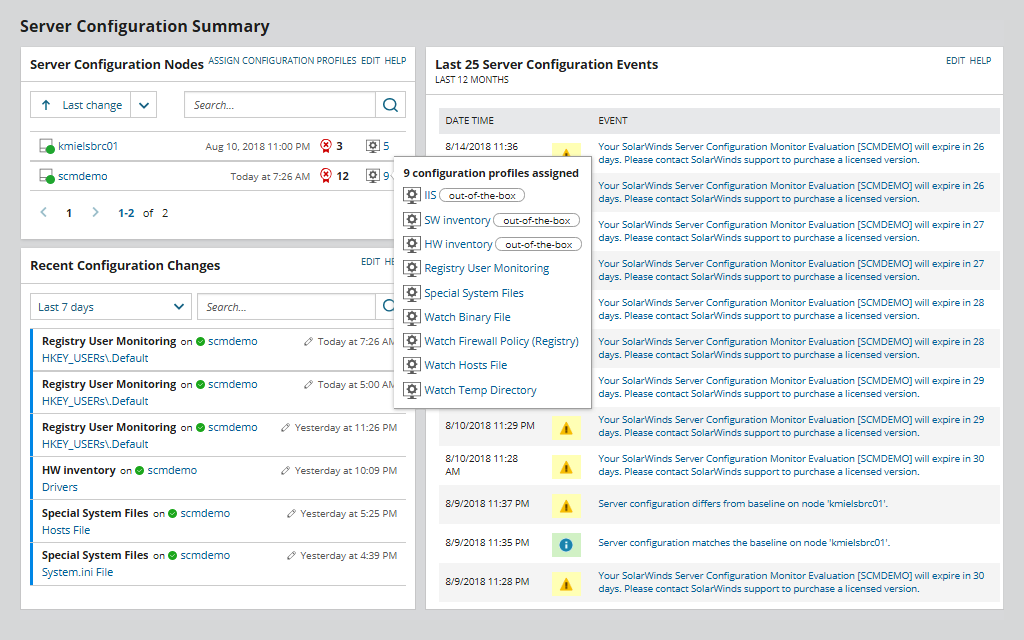
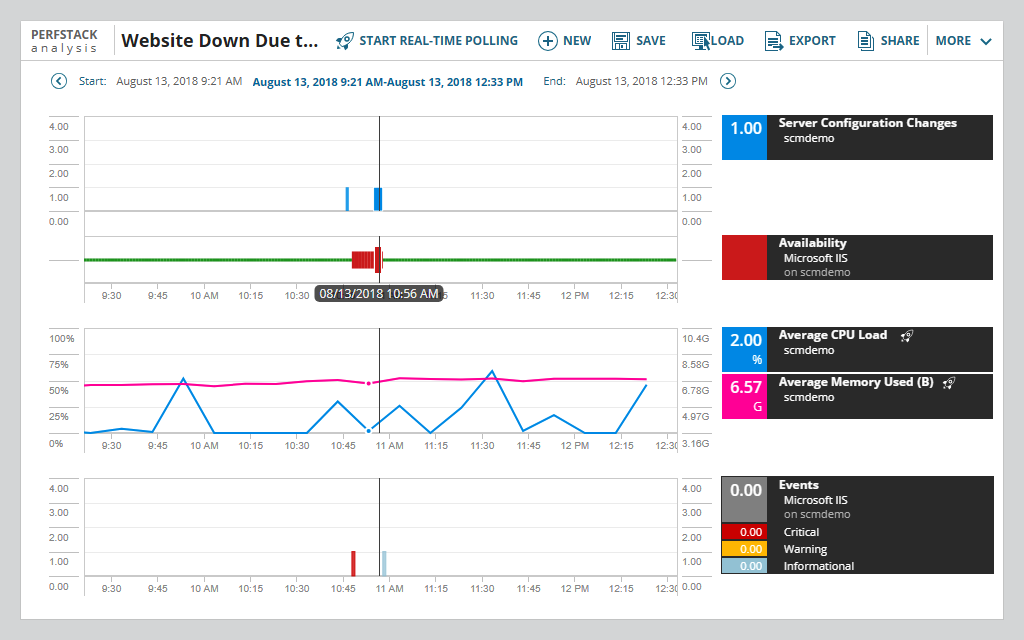
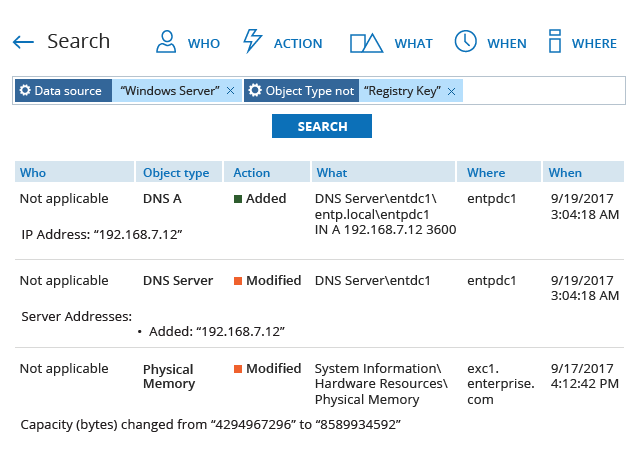
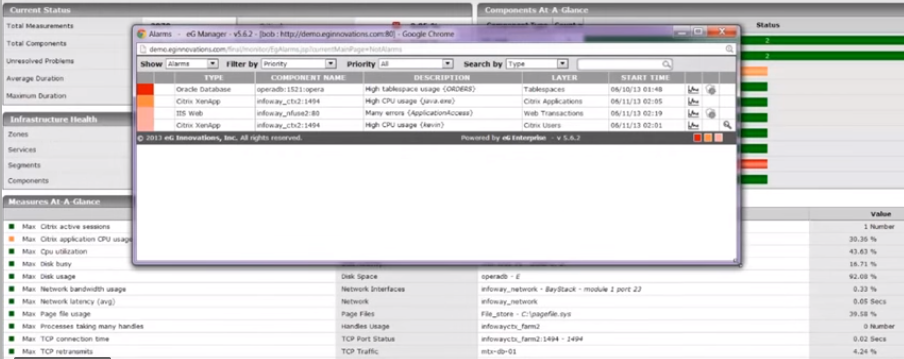
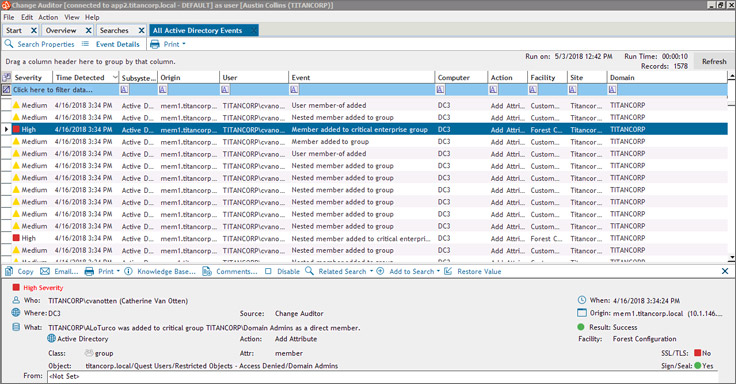
What’s unsettling is that even the most minor change to a server can have major impacts resulting in disruption of workflow in your Network. Which is why it’s important for an organization to have a system in place that tracks the changes. Especially in the current environment where you may have multiple admins making changes to the server. On top of determining the changes made you will also be able to tell who made the changes. One way that system admins have been using to monitor to manage server configuration is by logging the various changes to a spreadsheet. But this is not a sustainable method. It is prone to errors and also quite time-consuming. This is why I recommend that you use a configuration monitoring and auditing tool. It automates a lot of the tasks and logs the various changes taking place in the server like new software installations, settings modification, the addition of new hardware components among others. So the next time a change in configuration affects network performance you can easily revert back to previous settings through simple clicks rather than having to configure it all over again. These are the 5 best software you can use to monitor and manage your server configuration. SolarWinds Server Configuration Monitor is by far the most popular tool in our list. And I say this on pure merit not just because it comes from a reputable firm. SolarWinds may have made their name through the Network Performance Monitor but no one can dispute the effectiveness of all their other Network Management tools. The SCM is a comprehensive tool that gives you complete visibility into your servers for extensive monitoring. It uses a really easy mechanism where instead of having you track changes it shows you the exact changes so that you can fix them. What’s more, is that the logging of each change happens in an almost real-time basis which can be attributed to the use of agent-based monitoring. This allows you to detect problems early enough before they escalate. The use of an agent also means that the Server Configuration Monitor will continue logging configuration changes even when the system is offline. Once the network comes back on the data can then be sent to you for analysis. From the log data, you can see who made the changes, when and what changed. Since this tool keeps historical records of every change made, it allows you to have a baseline configuration settings, presumably when the server is in its best condition, which you can as a guide whenever there is a dip in performance. For those instances that a configuration change directly leads to poor network performance, this SCM has the perfect way to correlate the two graphically. It has a visual timeline that helps you pinpoint the exact changes that were made before the problem arose. Apart from external/internal changes, this tool can also be used to track changes made to the server by your own custom PowerShell scripts. It also allows you to manage these scripts from a central position and easily distribute them to your server environment. And finally, the SCM is a great tool to keep track of your hardware and software inventory. This Server Configuration Monitor is built based on the SolarWinds Orion platform which means you can easily integrate it with the other SolarWinds tools to achieve complete Network visibility. Also as part of the Orion system, it means that this tool can automatically discover the servers to be monitored. It comes with built-in configuration profiles for the most common servers which saves a lot of hassle in the setup process. Netwrix is another company that needs no introduction. Their Netwrix Auditor is a popular choice among Admins for the auditing of various IT systems and applications. The most common component is AD auditing but for now, we are more concerned with how it helps you monitor your servers and more specifically, the Windows server. It uses the same concept used by the SolarWinds SCM and only shows you the specific changes made to your server environment. The tool will then help you determine who, what, where and when the modifications were made. Additionally, it provides you with before and after values of the settings for better comparison. Netwrix is a comprehensive reporting tool that will enable you to generate auditing reports on the current server settings. At times when performance issues arise from changes in the server, you can compare the current data against previous settings from when the server was in optimum performance. This will help you quickly spot the discrepancies and fix them. As expected Netwrix Server Auditor comes with an alert system that will notify you about critical security events. To help you sort through server audit data, the tool has an interactive search area where you can enter criteria for the data you need. This data can be saved as reports and scheduled to be delivered to you at a specific time. Then there is this feature that you will not find in any of the other tools. Video recording of user activity. Although it is only applicable for the privileged users, it will be useful in those instances when the users modify the server but do not leave any data logs. The Netwrix server Auditor is available as both a free and a commercial product. Of course, any of them can do depending on your Organization’s size and needs. The free version has all the essential server monitoring features but lacks the advanced features such as Predefined reports with filtering, sorting and exporting options and cross-system auditing and reporting. eG Enterprise is a full IT performance monitor that includes Server configuration monitoring as part of its functionality. Apart from the servers, It can also be used in configuration monitoring of other network devices and applications. The tool allows you to check for configuration changes that may have occurred around the same time that you experience performance dips. It then correlates the configuration change with performance data to clearly determine whether the performance issue is due to automated, manual or unintentional configuration change. By eliminating guesswork, then you can quickly identify the real problem and work towards restoring peak performance. eG Enterprise uses both agent-based and agentless techniques to collect data from your servers and the information is viewed through an easy to understand central interface. This UI is web-based and can, therefore, be accessed from anywhere with a network connection. For those with multiple servers, this tool provides you with an easy way to compare configurations across them so that you can identify those that deviate from a golden configuration. This way you can ensure that all your servers are all in peak performance every time. The golden configuration will also act as a baseline for all future cases where there are performance issues as a result of configuration changes. Automation is a key part in configuration monitoring which is why eG Enterprise allows you to schedule automatic checks for specific times of the day. It will scan the server at these times and notify you if there is any change. Additionally, this tool can be used to track server assets. This is achieved through taking a snapshot of all the IT assets including Operating Systems, devices, Software, hardware, and Services. And since this is a complete IT infrastructure monitor, you can trace problems to other components of your network environments in the instances that they do not originate from the server. eG Enterprise can be used across multiple Operating Systems including Windows, Solaris, Linux, Virtualization platforms like VMware and applications like Citrix XenApp and Microsoft SQL. This is another great tool that can be used to provide real-time insights into the changes taking place in your Windows environment. On top of reporting changes on your Windows servers, this tool can be used to audit the Active Directory, Microsoft Exchange and Office 365, SQL server, Network Attached Storage, VMware, and other Network components. Quest acknowledges that it is hard if not impossible to manually track every user that has access to your file servers. And so, the tool tracks, audits, and reports on all the critical changes made to your servers. It also offers more insight by telling you who, what, when and where the changes were made. The tool also gives you before and after values of your configuration for quicker troubleshooting. One way in which Quest Change Auditor simplifies things is by allowing you to monitor multiple servers from just a single interface. Here you can compare their configuration settings against performance to come up with the golden configuration. This will then become your standard settings and you can deploy it across all your servers. Aside from server configuration monitoring, Quest Change Auditor can also be used to detect insider attacks. It achieves this by analyzing user behavior to identify suspicious changes that are meant to compromise the network. Critical changes and pattern alerts are sent to you via emails or SMS. But what stood out for me about this tool is its protection feature that encrypts the server components preventing any changes from being made in the first place. So then you don’t have to worry that an unauthorized change may lead to network downtime. The Quest change Auditor can be integrated with SIEM solutions such as Splunk where you can forward the collected data for further analysis and solution generation. Oh, lets also not forget that this tool will help prove compliance by generating comprehensive best practice reports for regulatory standards such as GDPR, SOX, and HIPAA. Power Admin is not as comprehensive as the other tools in our list but it will be great in detecting changes in the server like the creation and deletion of file and directory accounts. And by keeping up to date logs highlighting the various changes happening in your servers then you will essentially be complying with several security practices such as FIM. During the installation and setup of the PA Admin File and Directory Change Monitor, you will need to specify the starting directory and subdirectories if you want them to be checked. If the directory is not in the same Local Area Network as the computer, then you will have to use its UNC path to define it. You can also specify the specific files to be monitored by stating their file types. The tool has a ‘Monitor Files for Changes’ section where you specify what aspects of the files and directories you want to monitor. Then there is the ‘Files to Ignore section’ where you specify the names of the files that you don’t want to be checked. I know that this is a lot of configuration work but once it is set up then it should be good to go. The training feature will make your work a little easier as it enables the tool to develop adaptive behavior towards your settings. For instance, the tool will analyze the file types being added to your Ignore list for a certain period of time after which similar types are added to the list without having to manually do it. You can easily remove any component added to the list if it does not need to be there. Power Admin File and Directory Change Monitor works for both Windows and Linux environments.
The 5 Best Network Monitoring Tools and Softwares for ProfessionalsThe 5 Best Virtualization Monitoring and Management ToolsBest Tools for Ping Monitoring and ManagementThe 5 Best VoIP Monitoring Tools

