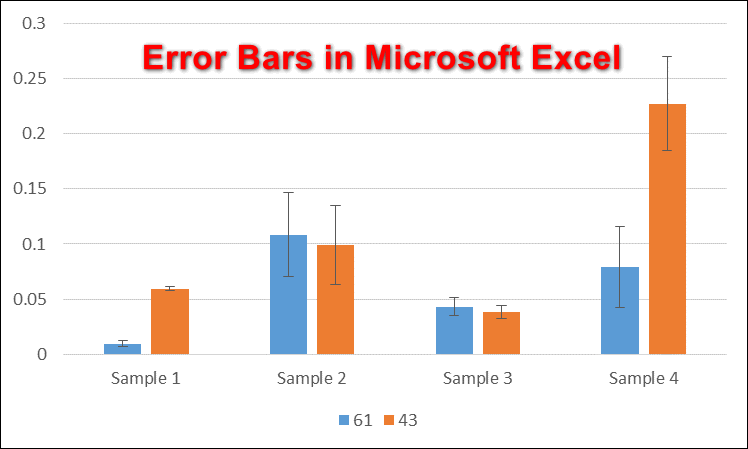
Adding Error Bars in Microsoft Excel
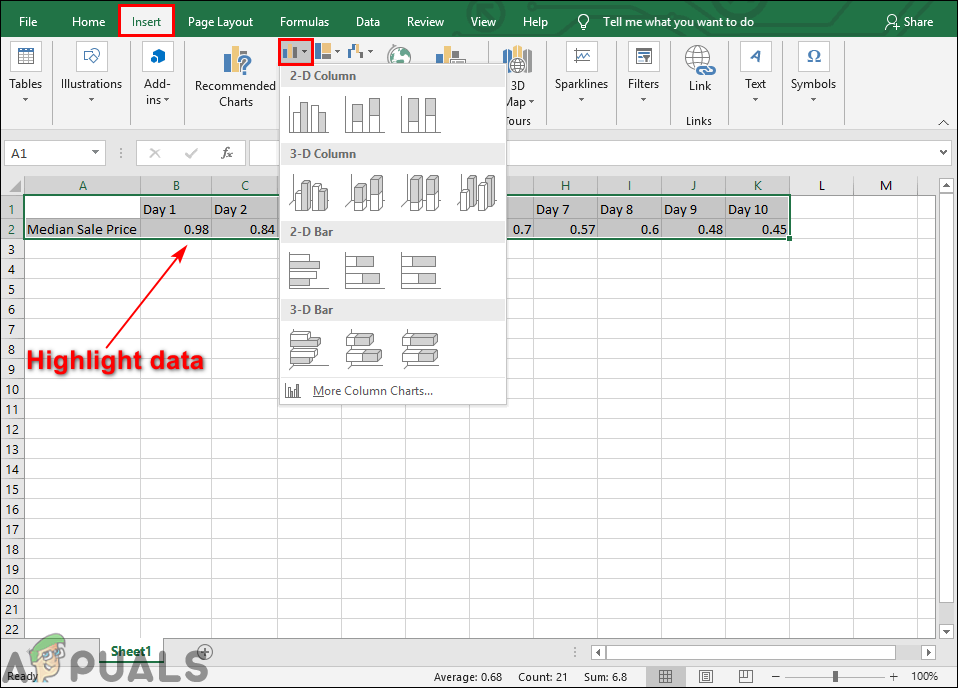
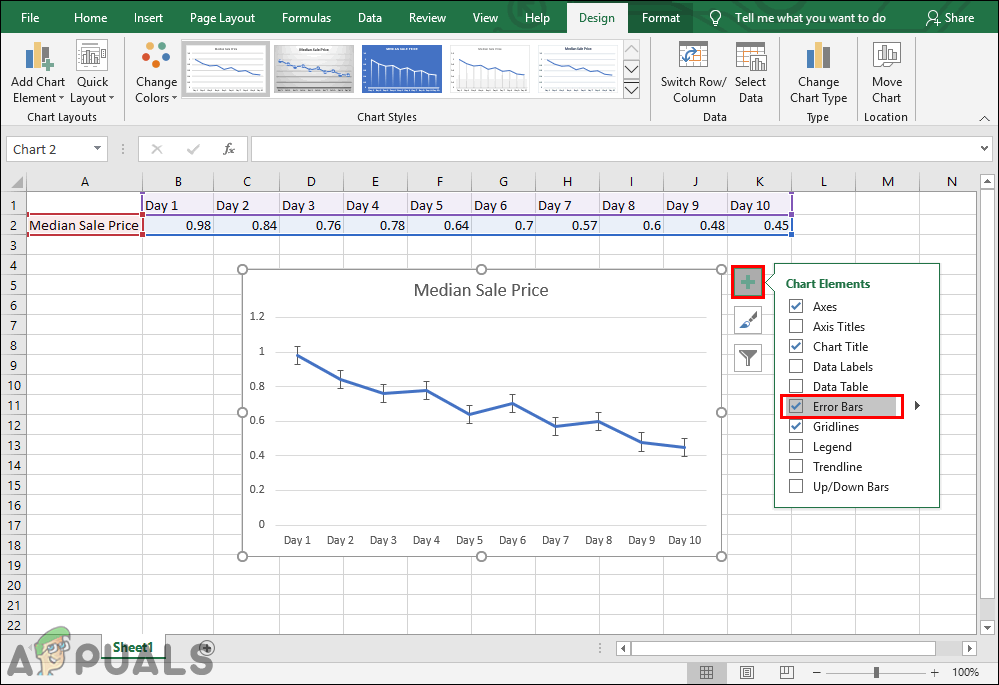
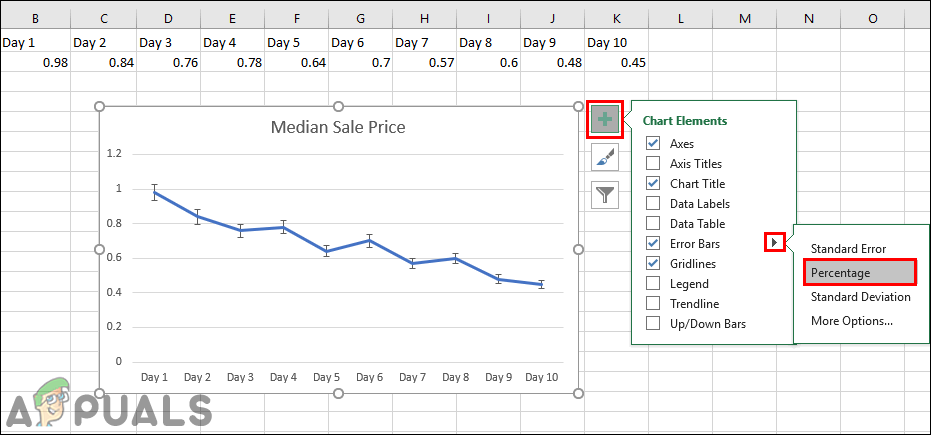
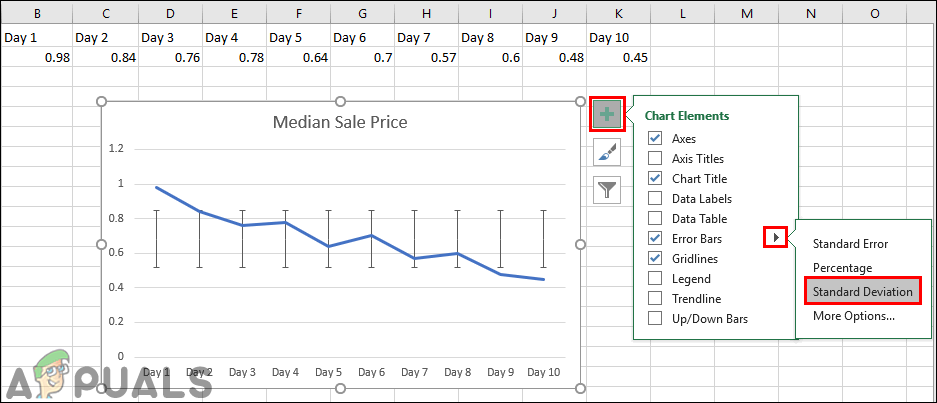
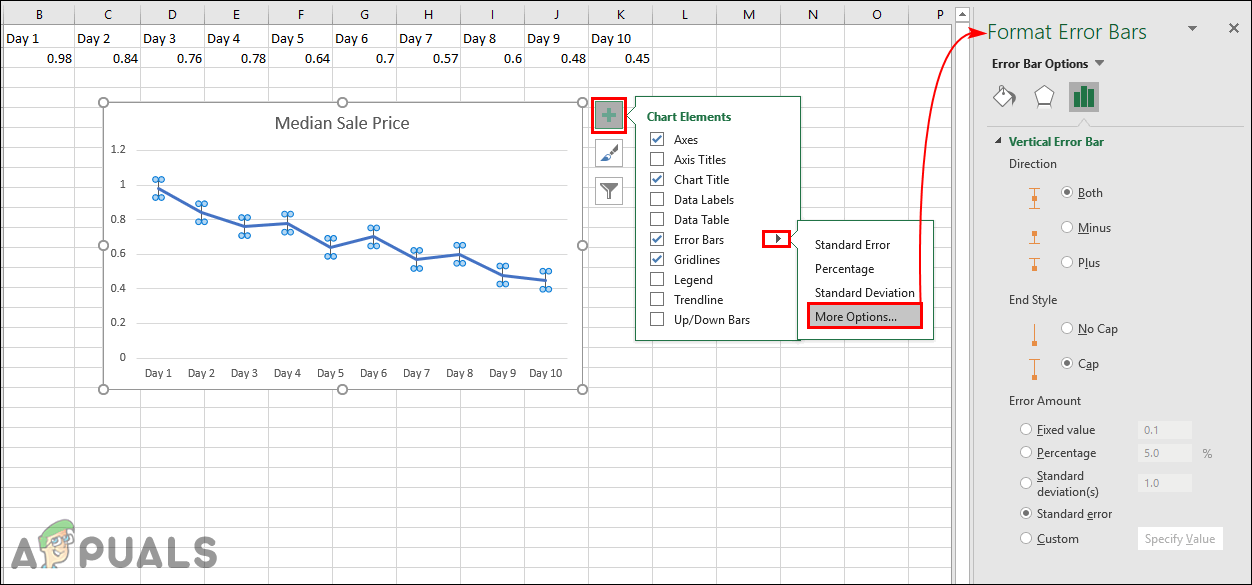
The error bars in excel can be applied to the scatter plot, dot plot, bar chart, or line graphs. The error bars help in providing an additional layer of detail on the presented data which shows the precision of measurement. By default, the error bars will show the standard error on the graph. Users can also use error bars for percentage, standard deviation, and for a specific value. There is also a menu for format error bars where you can easily change the colors, shape, direction, and much more for your error bars. Follow the below steps to add error bars to your chart in Microsoft Excel:
How to add error bars in Google Sheets?Fix: RDP ‘Remote Desktop’ Black Boxes/Bars and Screen Size issueHow to Add Axis Labels in Microsoft ExcelCannot Add or Create New Cells in Excel