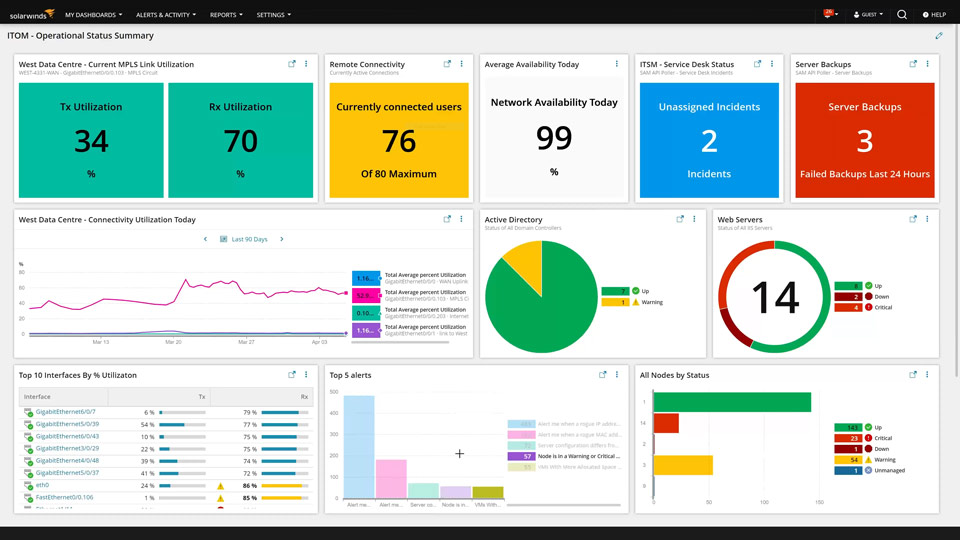
It goes without saying that monitoring your network performance is of utmost importance at this point in time. SolarWinds Hybrid Cloud Observability allows you to counter the challenge of troubleshooting issues in a hybrid IT infrastructure along with the identification of the root cause of any issue. With the help of the Hybrid Cloud Observability tool, you are able to combine various tools in a single interface or solution that allows you to monitor and observe your cloud environments from AWS and Azure quite easily. With that said, let us get started and show you how to implement the mentioned tool in any cloud environment so that you can track your issues more quickly and efficiently.
1. Installing Hybrid Cloud Observability
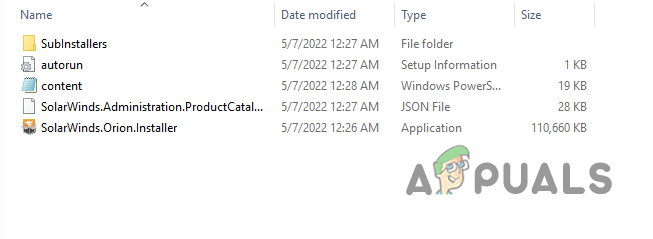
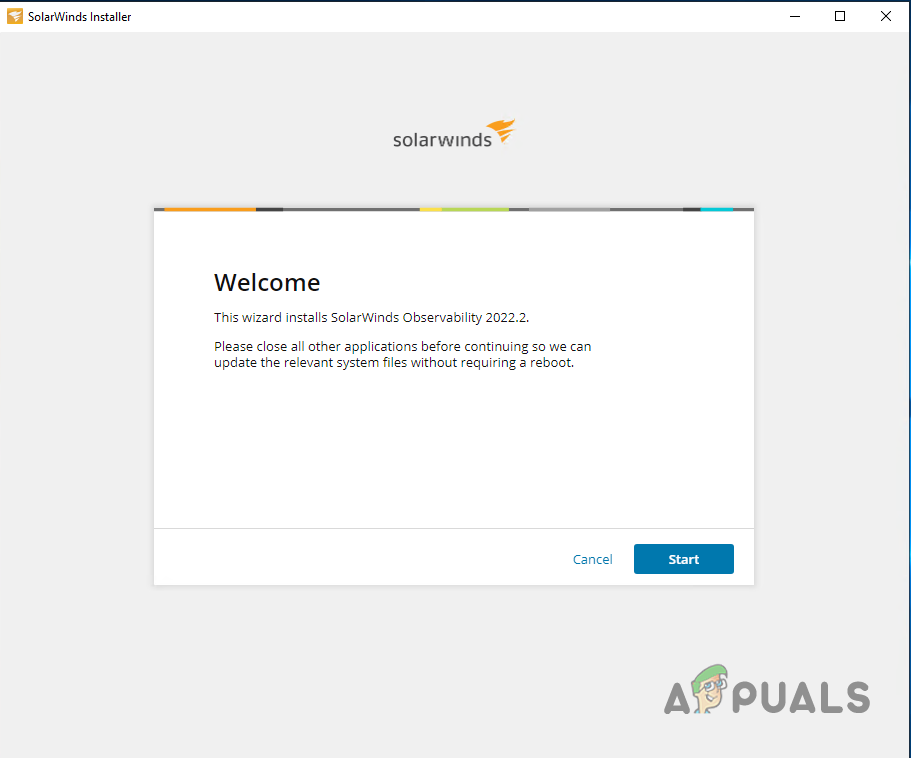
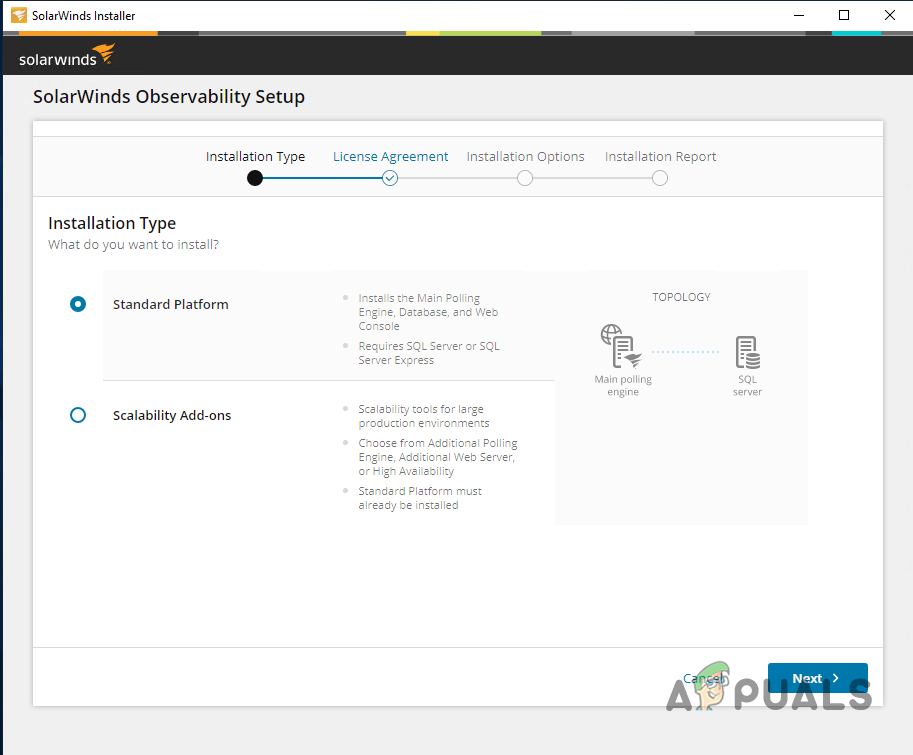
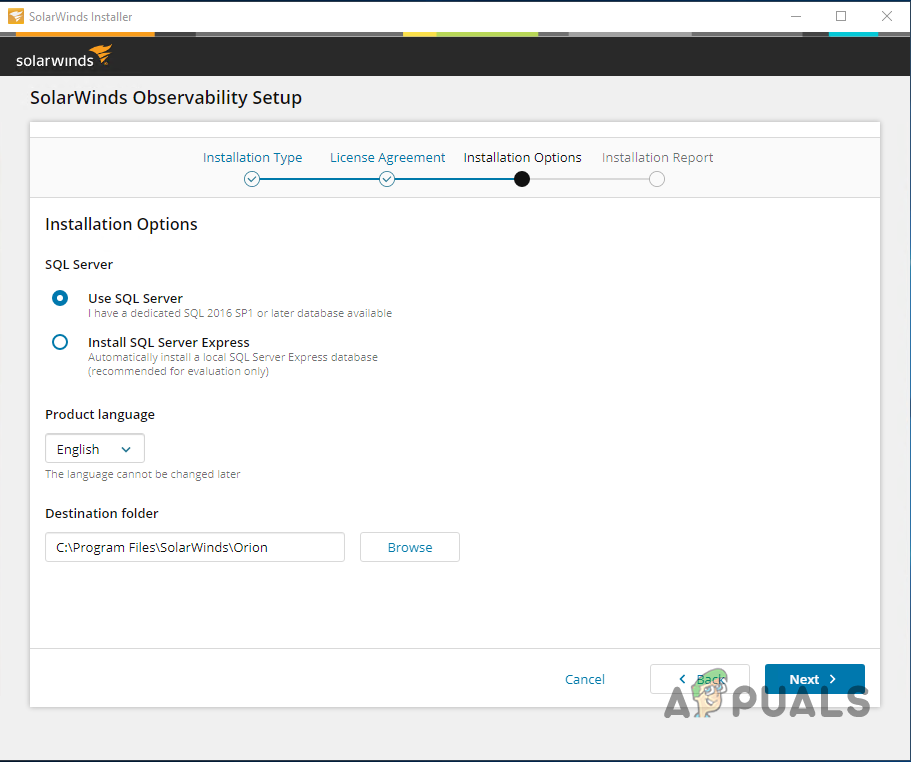
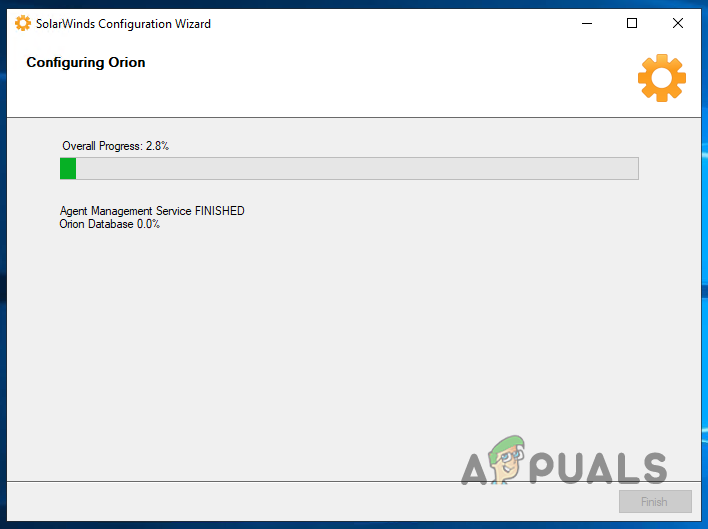
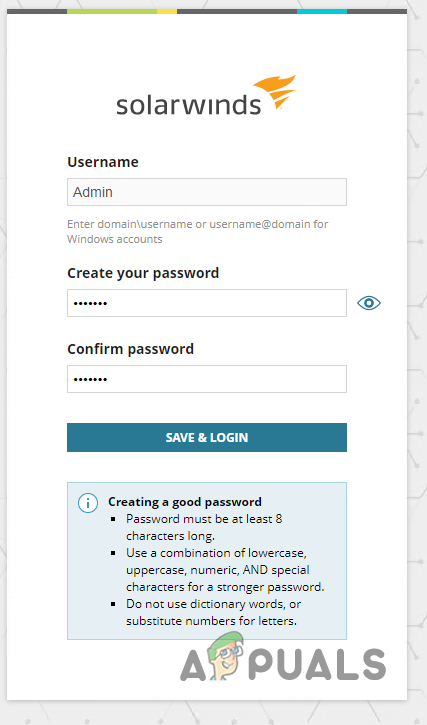
First things first, you will have to download and install the Hybrid Cloud Observability tool. This is fairly easy and you can opt for a trial period in case you wish to try out the product before purchasing it from SolarWinds. To download the tool, simply head to the link right here and fill out the form to download a 30-day, fully functional, free trial. Once the tool has been downloaded, follow the instructions down below to install it.
2. Using the Orion Web Console
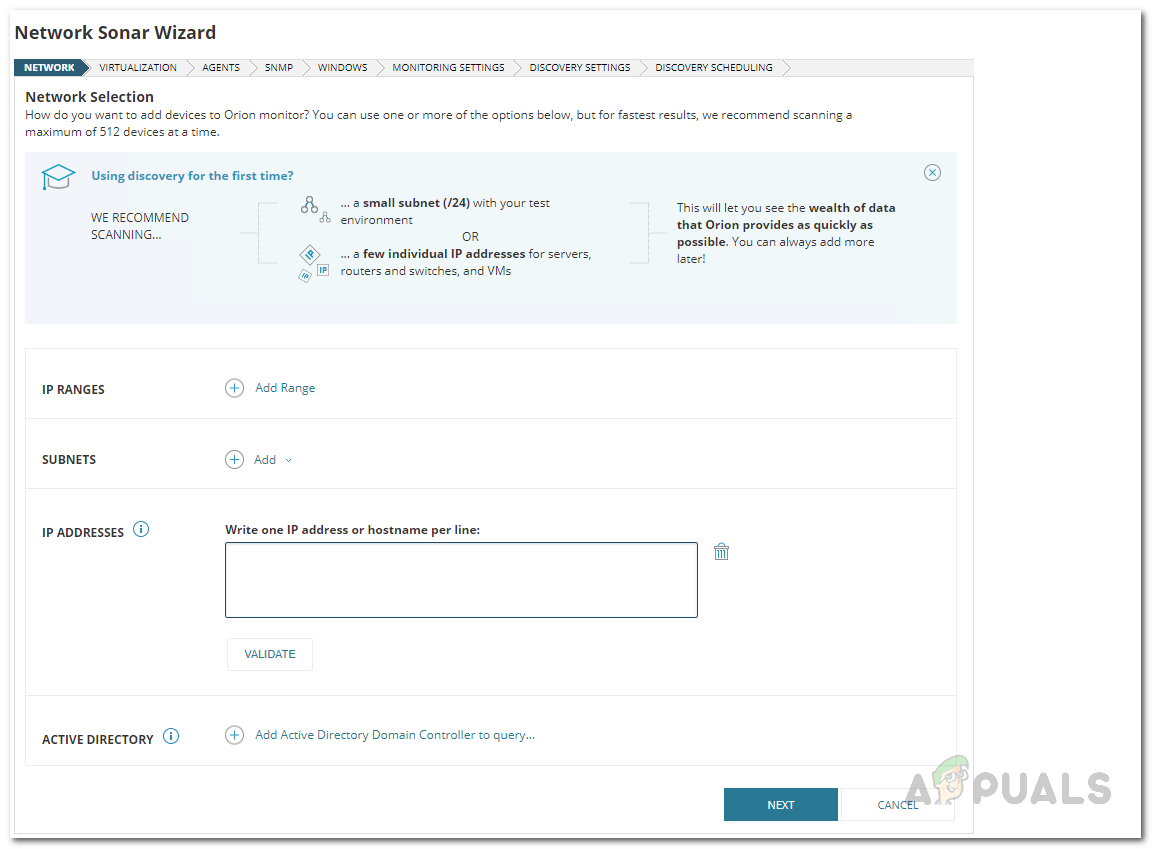
Now that you have installed the Hybrid Cloud Observability tool on your end, you can finally begin to use the various features of the tool to monitor your IT infrastructure, including Cloud accounts and more. As it turns out, the first step involves scanning your network using the Network Sonar Wizard tool. Using this, you can scan all of the nodes in your environment and then have the performance metrics on a dashboard for you. In case of any issues or node failures, you will be notified instantly and you can also set up an alert system that notifies you via email if that’s what you prefer. With that said, let us get started with discovering your network.
3. Using Network Sonar Wizard
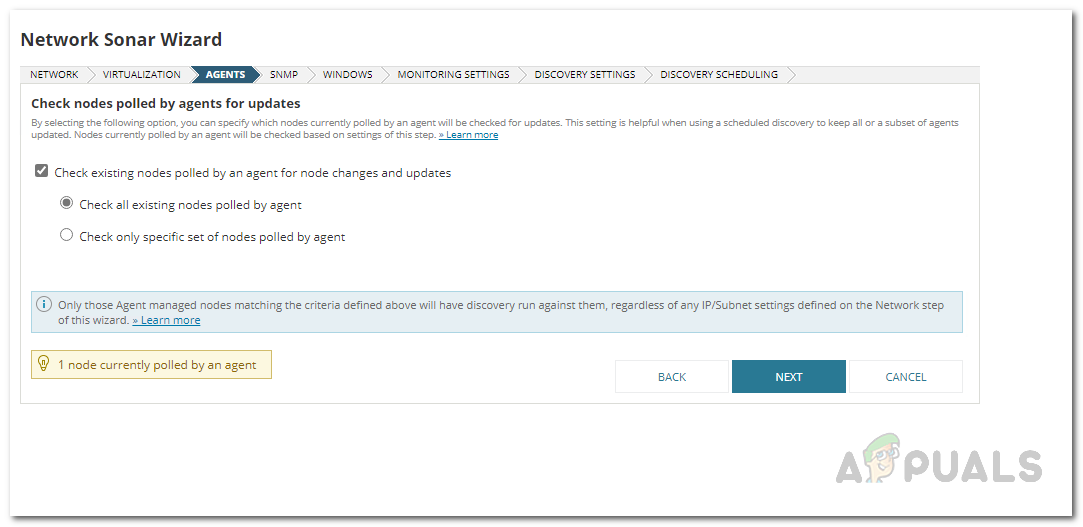
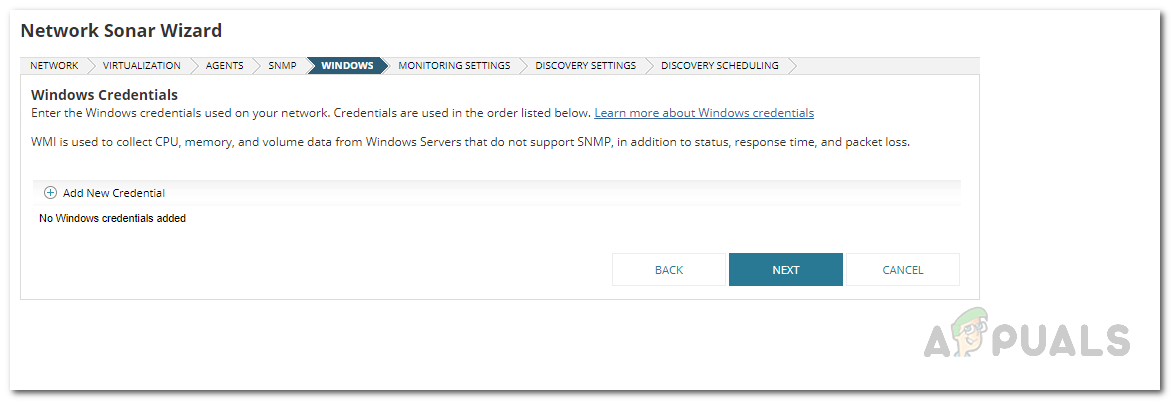
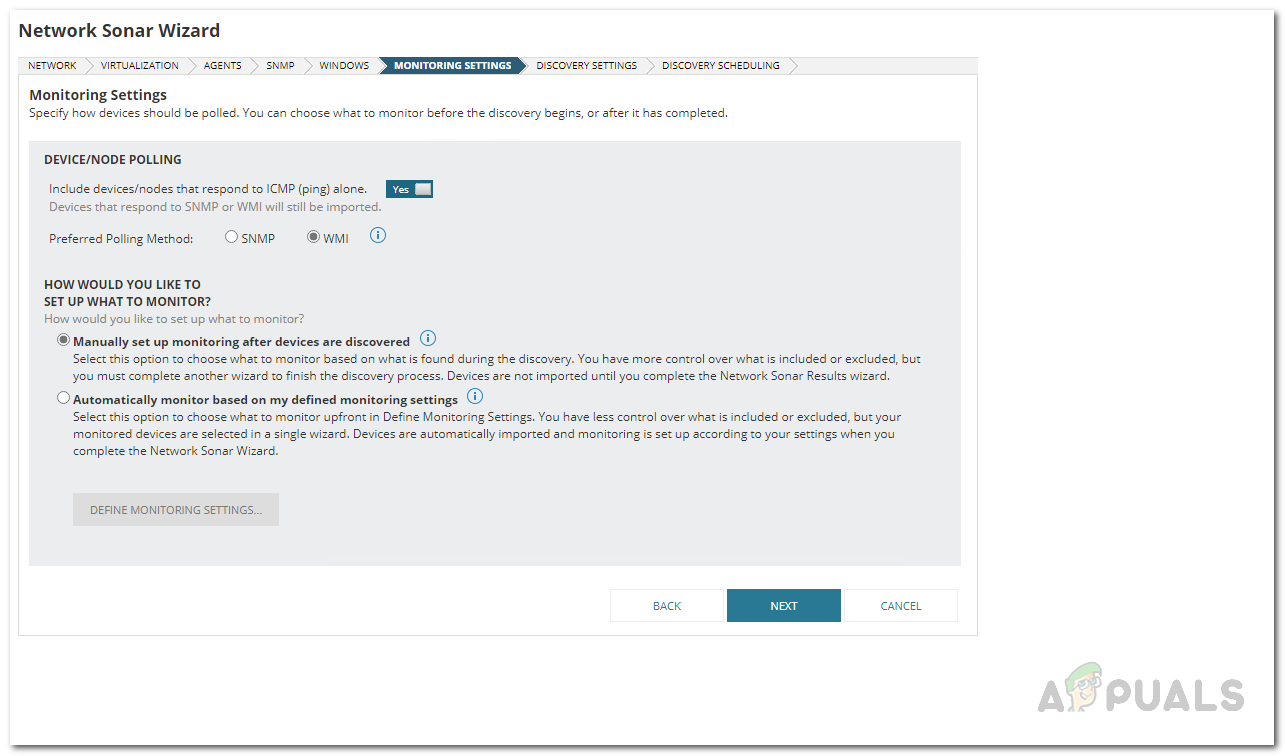
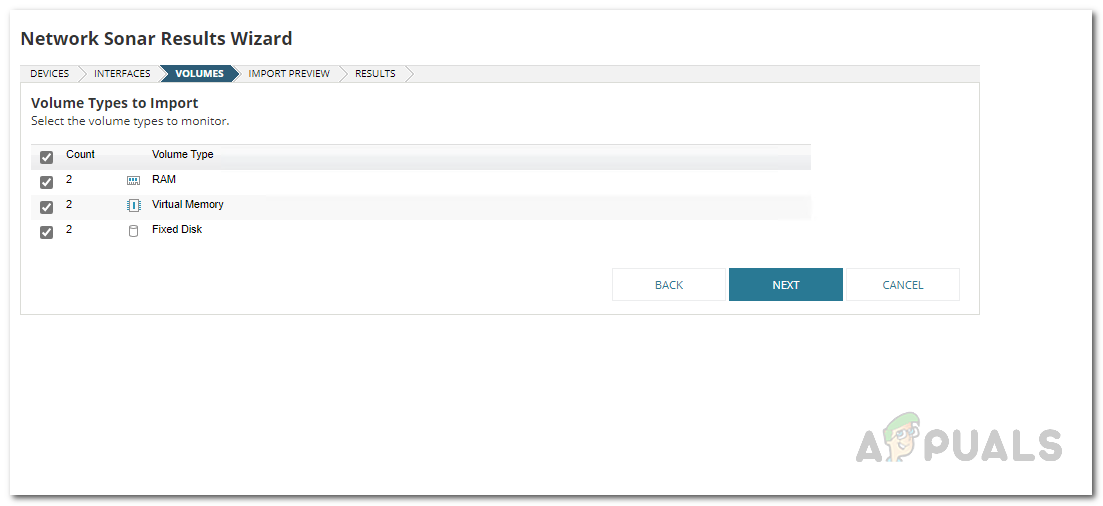
Using the Network Sonar Wizard tool is quite simple and it only requires a few simple steps. Let’s jump right into it. At this point, wait for the discovery to finish.
4. Adding Discovered Devices
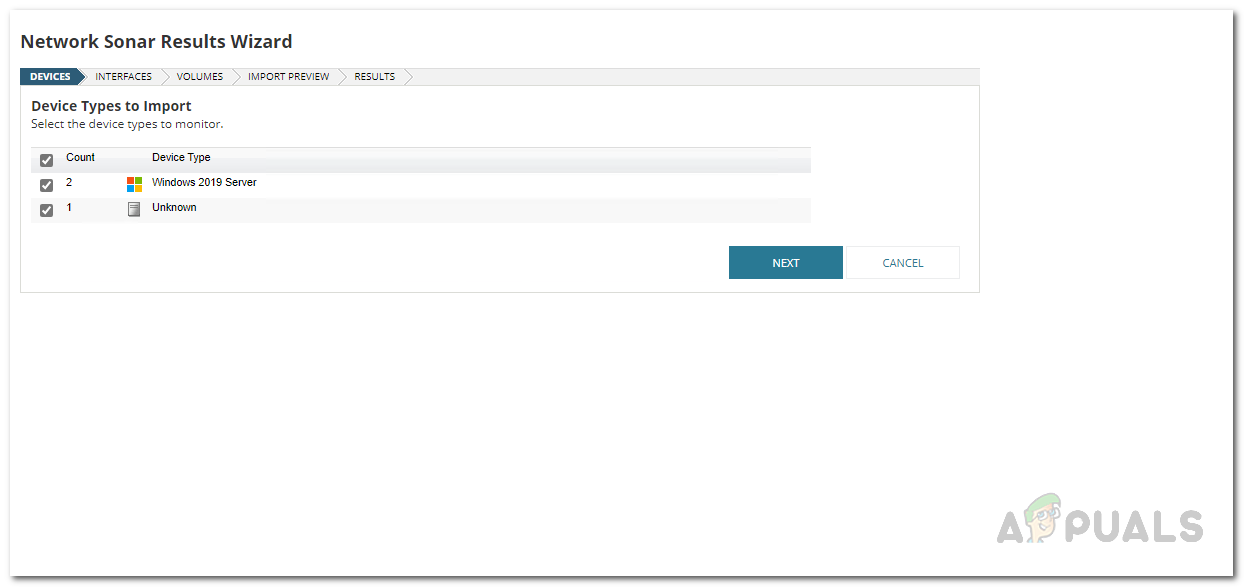
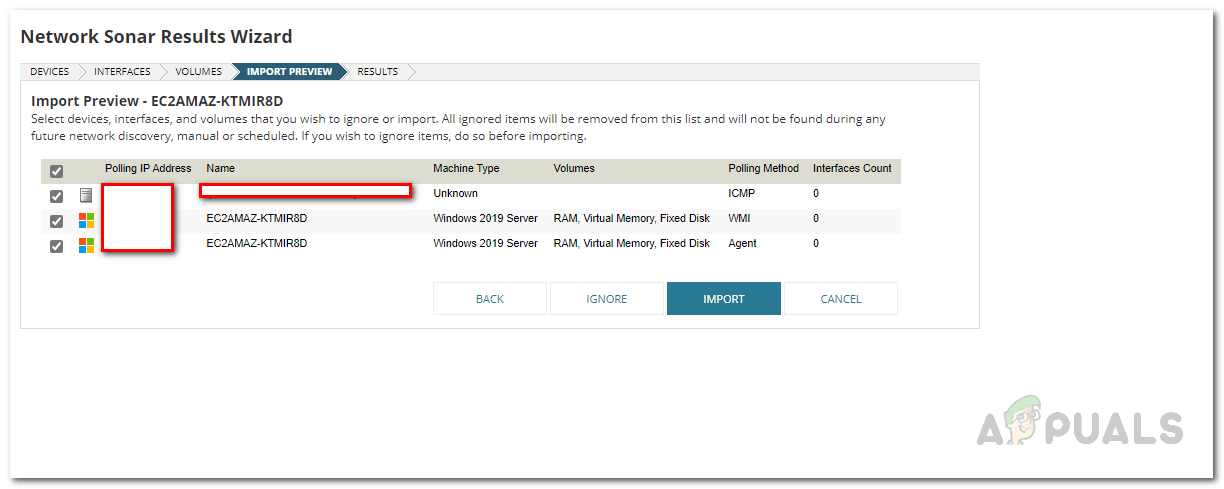
Once the discovery process has been completed, you can add your discovered network so that it will be monitored and you can get timely updates. To do this, follow the instructions given down below: With that done, you have successfully added your discovered devices.
5. View your Infrastructure
At this point, you have completed all the necessary steps in order to add your network to the tool so that it can be monitored. You will be shown the performance metrics along with a lot more information momentarily on the Hybrid Cloud Observability page of the dashboard.
AMD’s Next-Gen RDNA 3 GPUs to Feature Enhanced Ray-Tracing Capabilities Using A…How to Monitor Meraki Wireless Infrastructure in Network Performance MonitorHow to Observe a Fully Centralized View of your IT Infrastructure?[FIX] ‘Shell Infrastructure Host’ High CPU Usage on Windows 11
